AITA Analysis
2023-10-18
I actually made a separate page for this project that explains the reasoning and outcome for the project in general. It includes a lot of charts and other insights on the findings of this little experiment, and I would love it if you took a look for yourself here: r/AmITheAsshole Data.
On this blog page, we'll talk about the code behind the project instead, but let's have a quick background first.
My wife is a frequent reader of a message board called Am I The Asshole, which you can find on the site Reddit. It's here that people will post their stories about some conflict they may be having with a family member, co-worker, etc., and the community decides if they are the asshole in this situation or not by leaving comments with specific abbreviations like YTA (You're the Asshole).
An example:

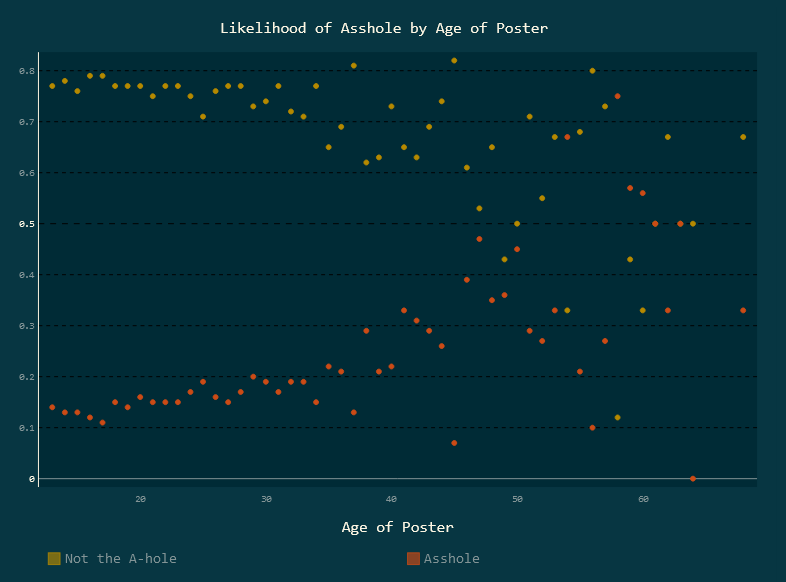
She ended up with a hypothesis that posts where the original poster (OP) was writing about their romantic partner and where the OP was the older of the two were more likely to be branded as assholes, and this kickstarted me into the first part of this project.
Gathering Data
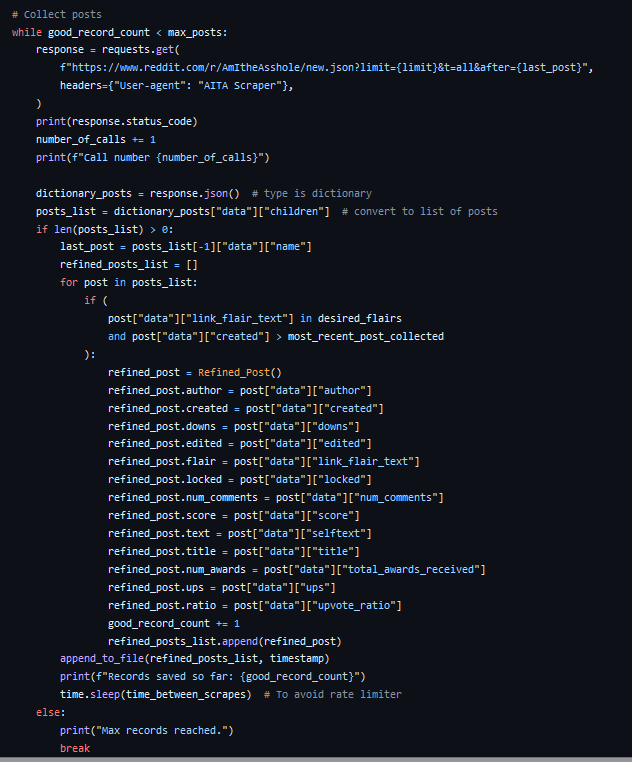
In order to make any kind of analysis work, I was going to need a lot of examples of posts. This was where the file for collect_posts.py was started. It ended up evolving a lot over the course of the project. Using the requests library in python, it was actually easy to hit Reddit's API for recent posts. I had a bit of a scare here when Reddit moved to lock their API behind a paywall, but thankfully the GET routes were unaffected. There were some caveats though. It only returns posts in chunks of 100 at a time, and even if you step back a few chunks, it maxes out at 1000 posts back from the most recent post.
This meant that I needed a way to consistently collect posts and store them for later use if I wanted a large sample size. To keep things simple, I would store each day's posts in a CSV file, checking to make sure there were only the flairs that I wanted to capture. I'm not going to lie, this was a messy process, but it got the job done.
If I could go back and make one change, it would be to schedule this on a cron job somewhere. Maybe I could have done that using the Raspberry Pi, but it always seemed like I was close to being done anyway, so I didn't prioritize it.
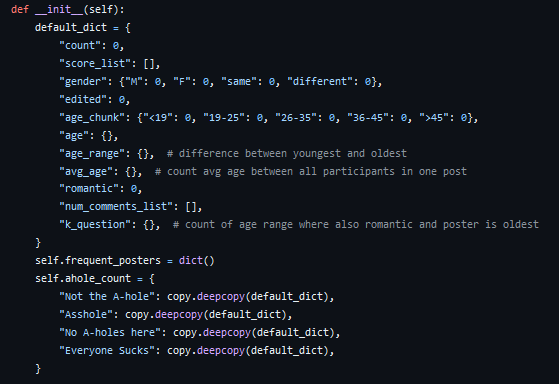
It became apparent pretty quickly that all these raw posts needed to be combined in some way. Using combine_csv.py and a Refined_Post class I made, this actually ended up being fairly straightforward. By feeding Refined_Post each row of a CSV file, it simply performs all the transformations that I wanted in its constructor.
The Refined_Post class grew with each stage of this project, allowing for small analyses of each post, such as finding the age and gender of a poster, seeing if the post might be romantic in nature, and determining the age gap between the poster and other participants in the story.
Analysis & Display
All this data means nothing if it can't be observed in a meaningful way. Using run_analysis.py and a class titled Stats_Bundler, more than 30,000 of the previously-combined posts are stepped through and tallied in a deeply-nested Python dictionary. This gave me a lot of practice in looping through dictionary keys and values, but I don't think it was the most elegant solution. I might just not be a Python fan.
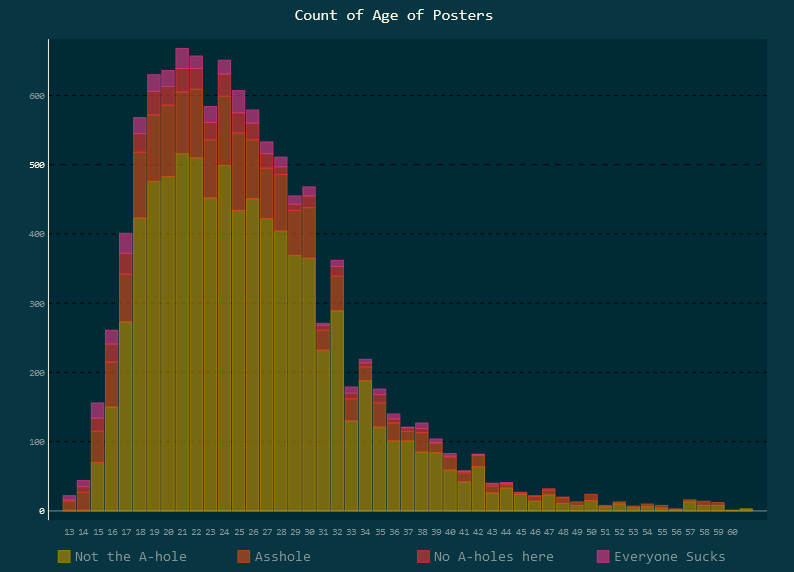
This is fine for numbers, but it doesn't make for a very consumable result. Using a library called pygal, I was able to make a series of charts to display the data collected in the Stats_Bundler class. This library actually came with some very nice design styles, even if they are a bit difficult to read at times.
Here are two of my favourites:
In order to share these charts, I decided to try out Vue. I'm admittedly a React native, but I've always wanted to try out some other options, and this was an opportunity for a small project. I actually think Vue might be a real blast to work with, but I could see how it might be difficult to maintain in bigger projects. Same can be said of all frameworks though.
The toughest part was getting it to deploy to GitHub Pages properly. Turns out the deployment automation works best when the index file is in root, not a sub-folder, so with a bit of trickery I got it working.
Hindsight
This project went on a lot longer than I had hoped for when starting out. A lot of that was time collecting posts, but also I felt like I was losing interest in the project after a few months of waiting. It can be hard to get that motivation back.
As always, please check out the GitHub repository for this project to see some neat code.